Structural imaging
Measures the anatomy of the brain
- Derived from T1/T2 MRI scans
- Structural measures
- Volume, Cortical thickness, Surface area
- Data structures
- Images
- Regions
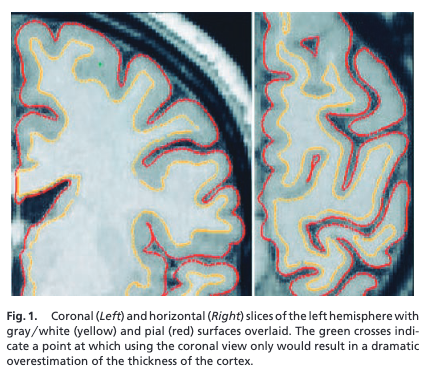
- Gray matter surface
- Structural-based “similarity” networks
Freesurfer: structural analysis software
- Cortical surface estimation and analysis
- Now over 25 years old
- Many tools now built on analyzing data on the surface
Functional imaging
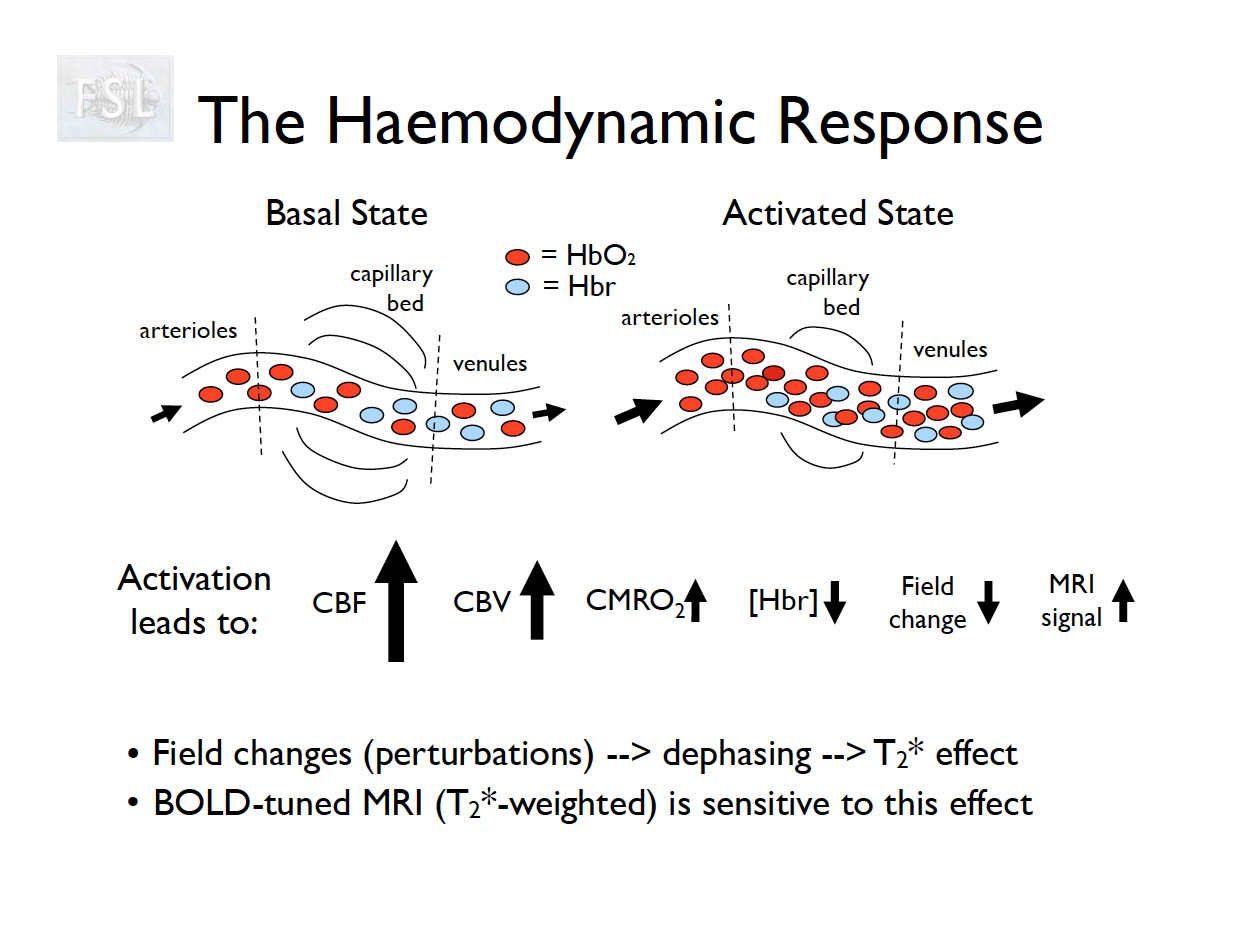
Measures brain functioning (inferred by deoxygentated blood)
- Blood oxygen level dependent (BOLD) activity
- History of functional MRI (Bandettini 2012)
- functional Magnetic Resonance Imaging (fMRI) are time-series data
Types of fMRI data
- task fMRI – acquired doing a task
- resting state fMRI (rs-fMRI) – acquired doing nothing
Task fMRI overview
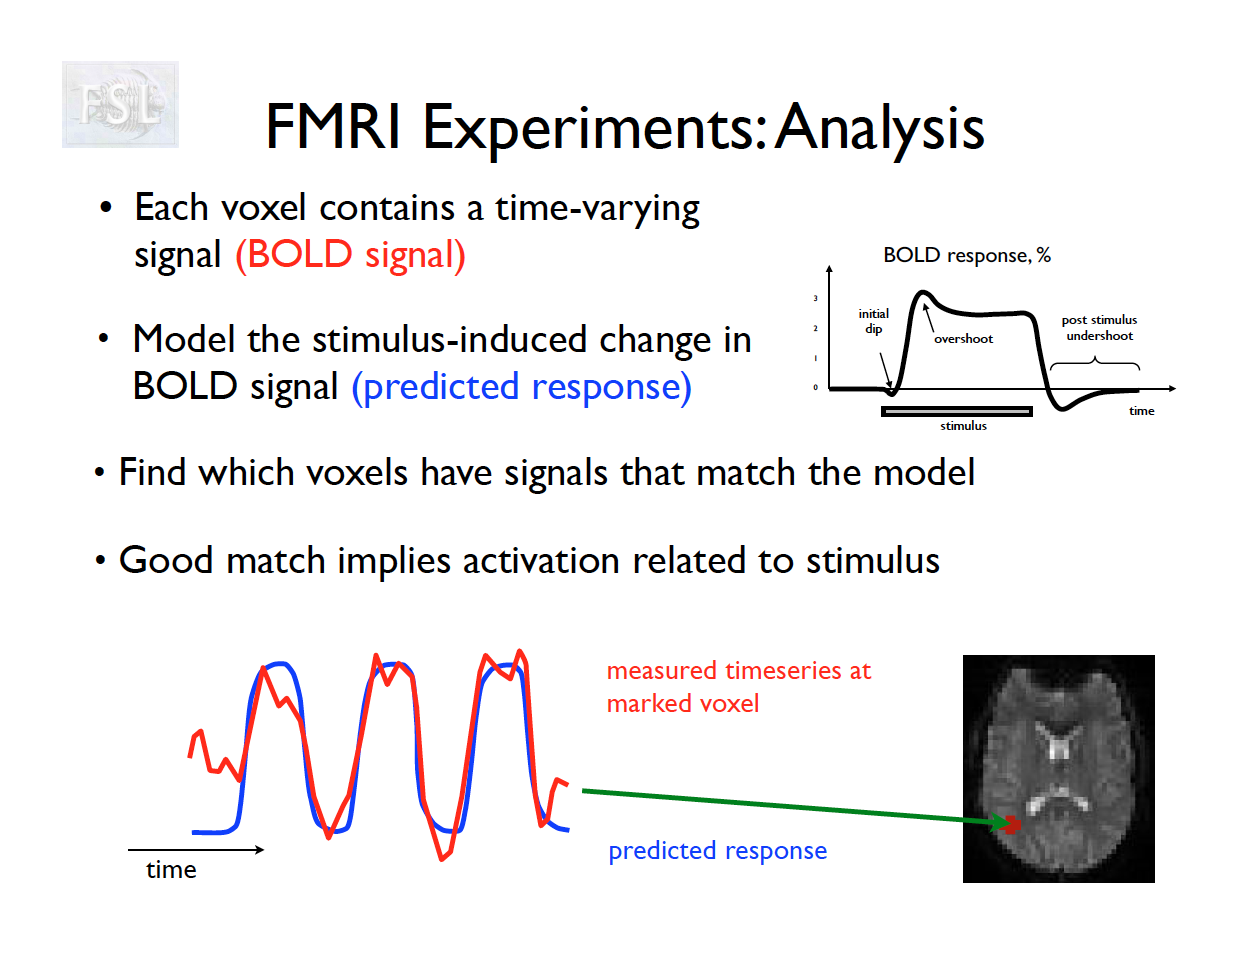
- Measures brain activity during a task using BOLD signal.
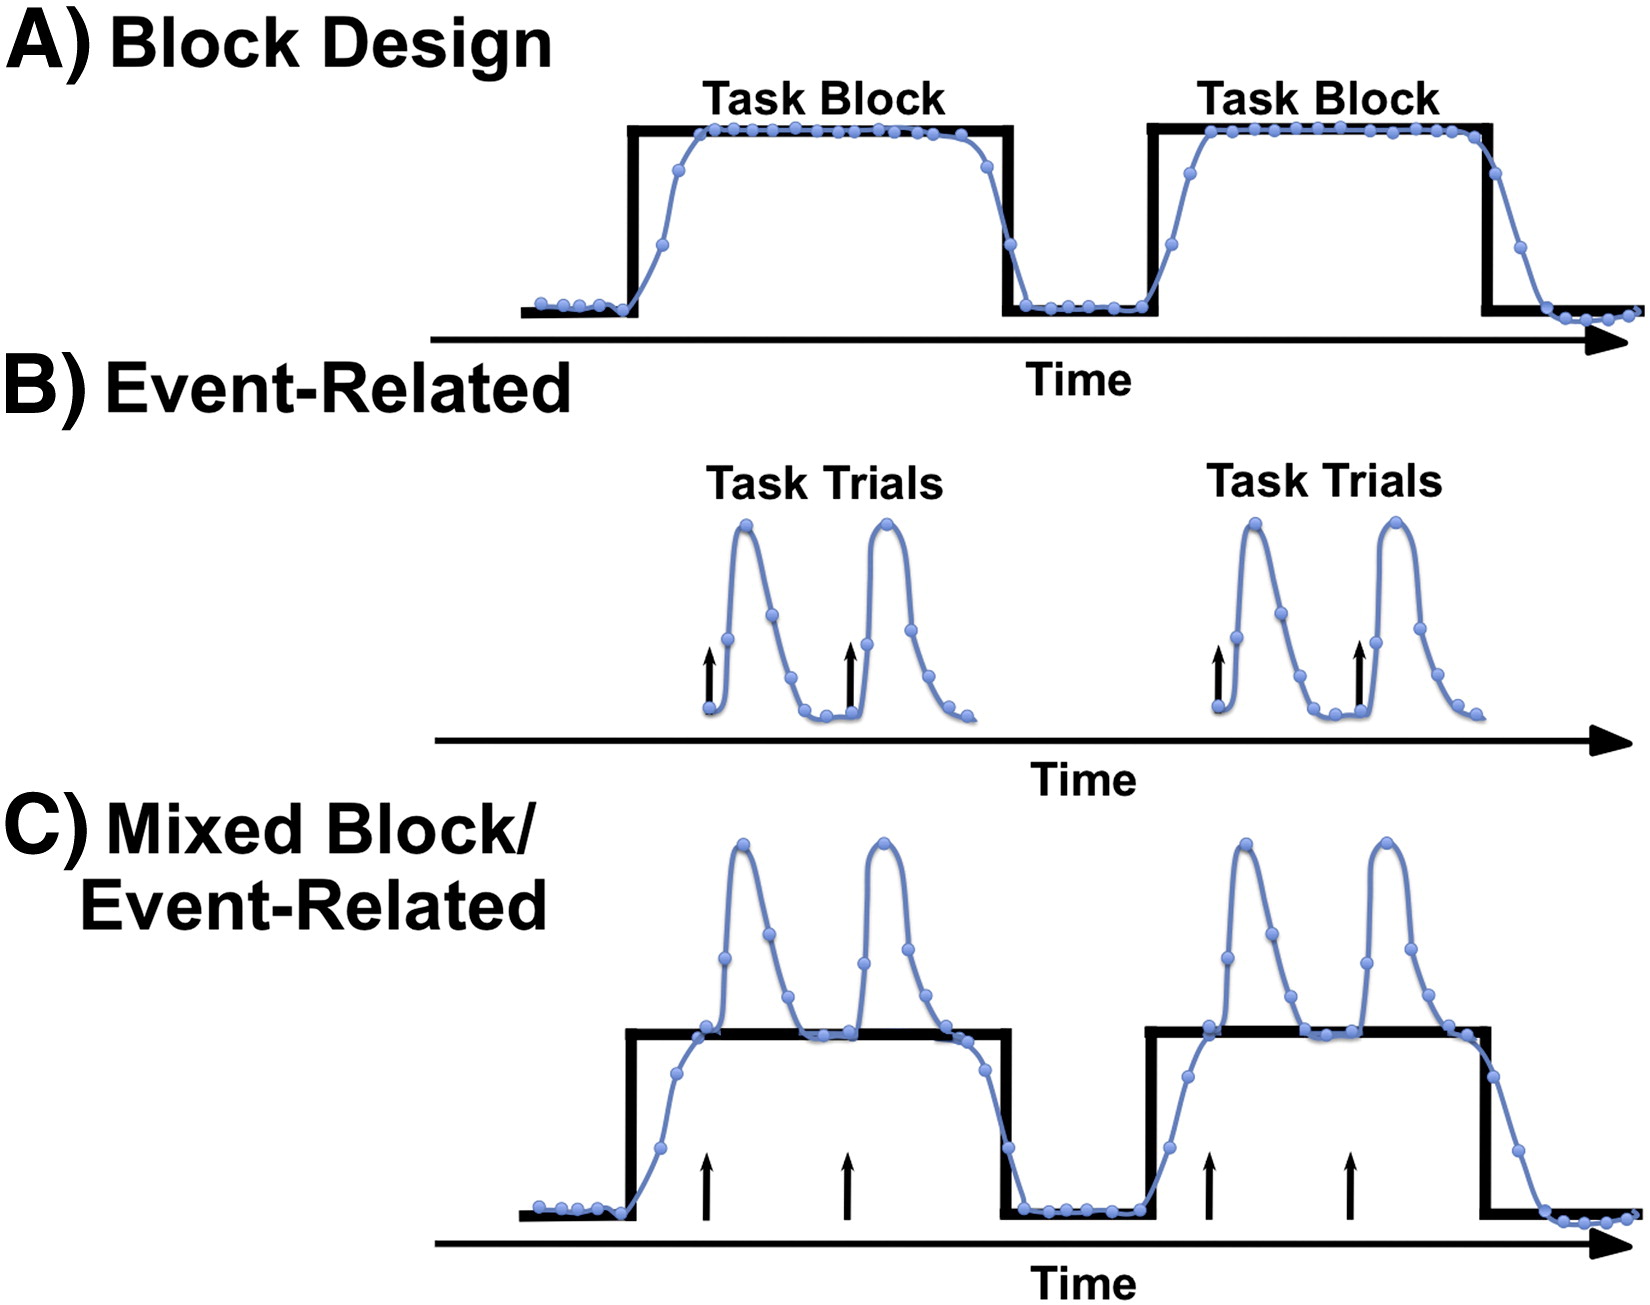
- Block design: repeated task periods alternating with baseline (e.g. 30s task, 30s rest).
- Event-related design: timing randomized, short stimuli.
- Naturalistic: E.g., viewing a movie.
- Analysis fits a time-series model and compares conditions.
- Data structures
- Images, Regions, Gray matter surface
Notes on illustration
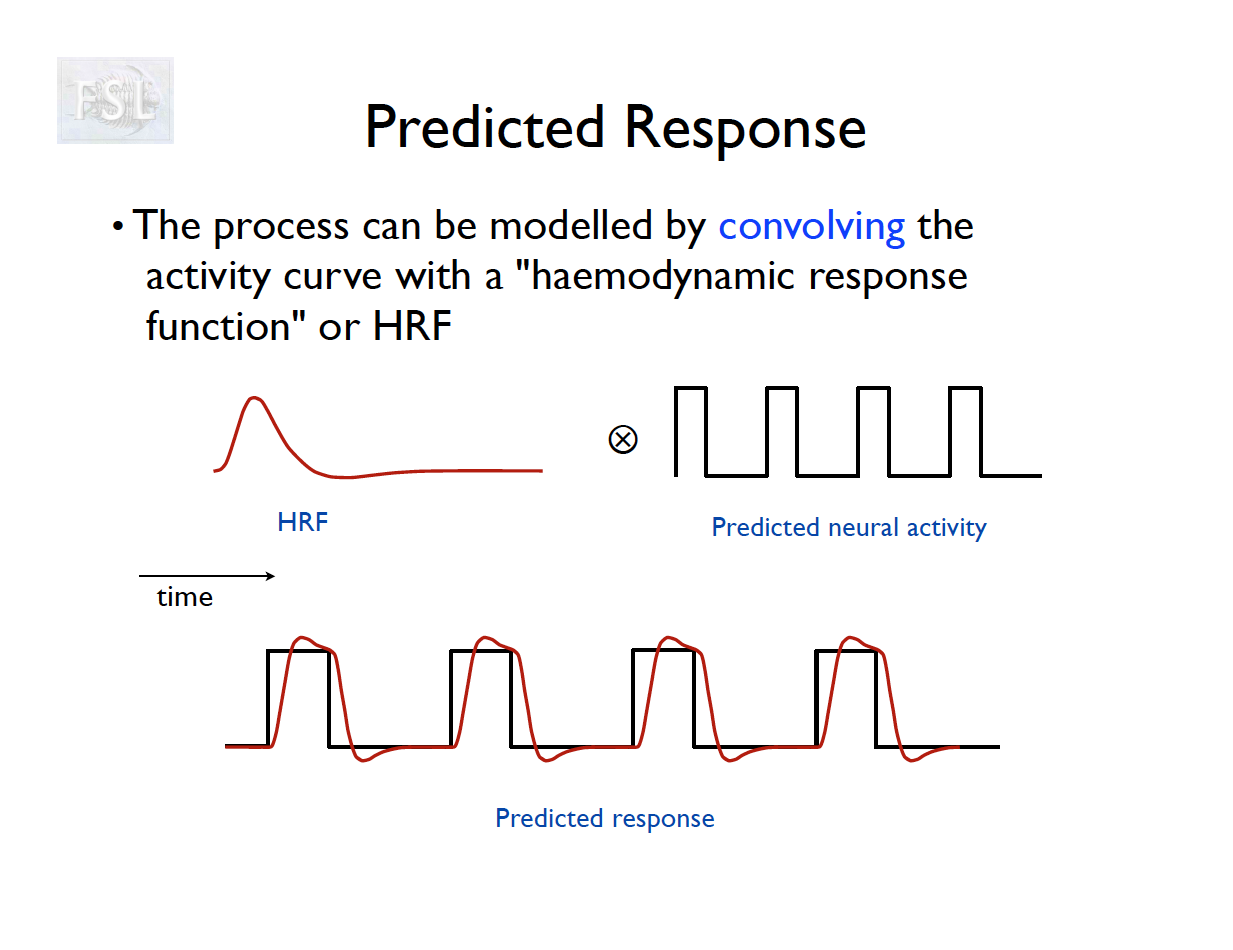
- Known stimulus time series are convolved with an assumed hemodynamic response function (HRF)
- HRF is well studied, often assumed, and likely inaccurate for many brain regions REFs
- Hemodynamic (blood) response to stimuli is slow.
- fMRI sampled every 1.5-3 seconds or so.
- RBC fMRI parameters
rs-fMRI
- What it is? Correlation between fMRI time-series in the brain at rest (doing nothing).
- History: Biswal 1995 first study to do this
- Now, things are quite a bit more sophisticated
- Data structures
- Images
- Regions
- Gray matter surface
- Networks
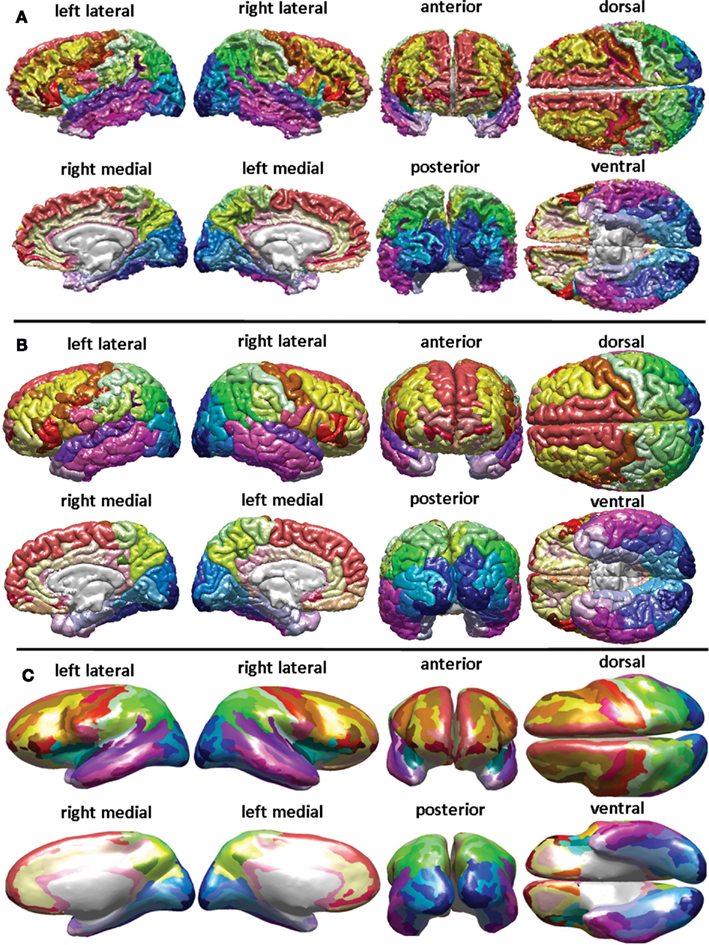
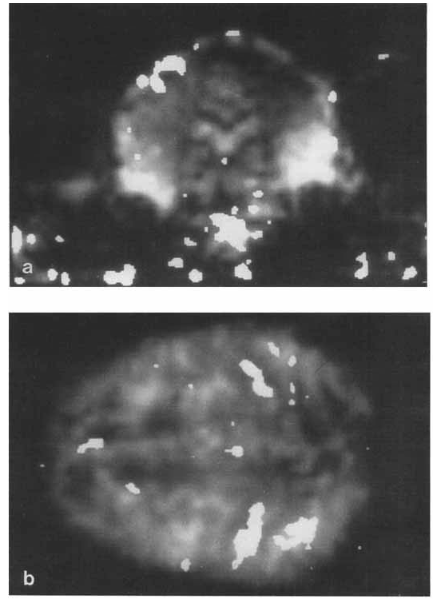
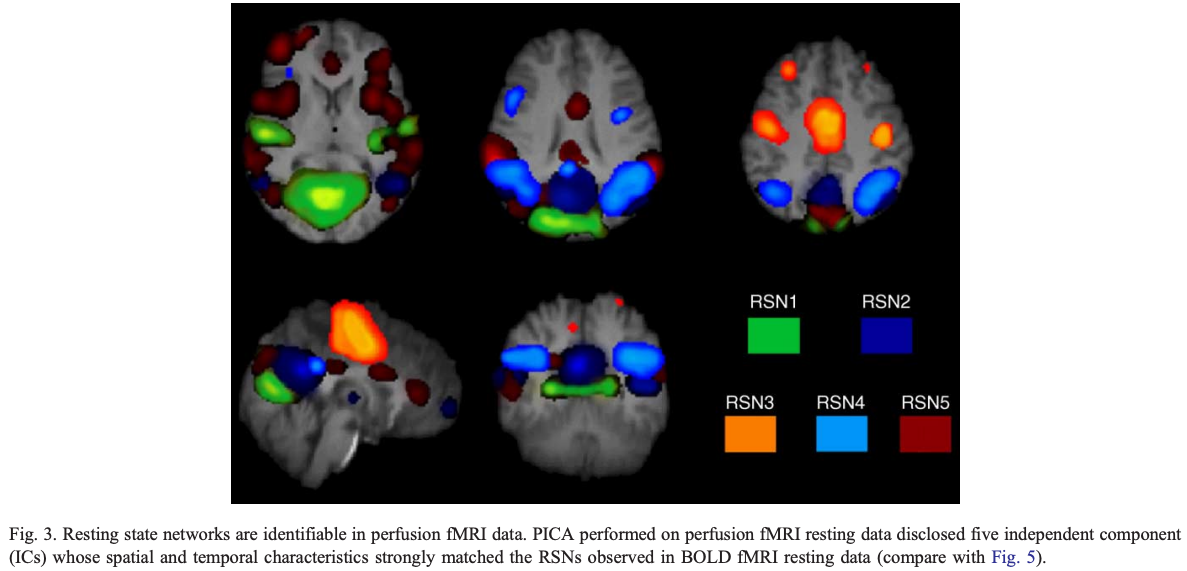
First resting state networks (De Luca)
Published in 2006 using independent components analysis
![]()
Early resting state networks De Luca 2006
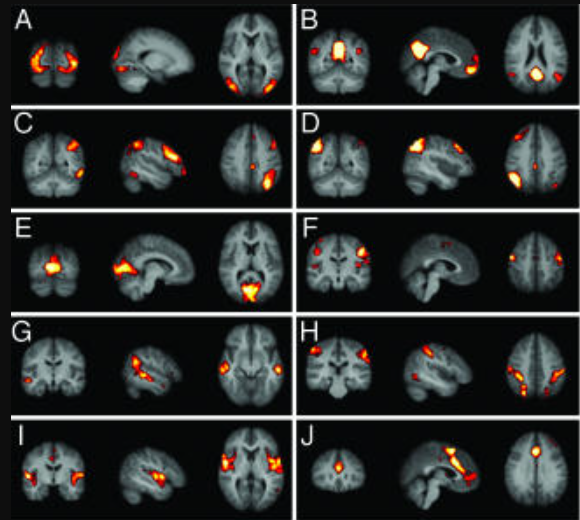
Resting state networks (Damoiseaux)
Published the same year, using a different ICA method.
![]()
Early resting state networks Damoiseaux 2006
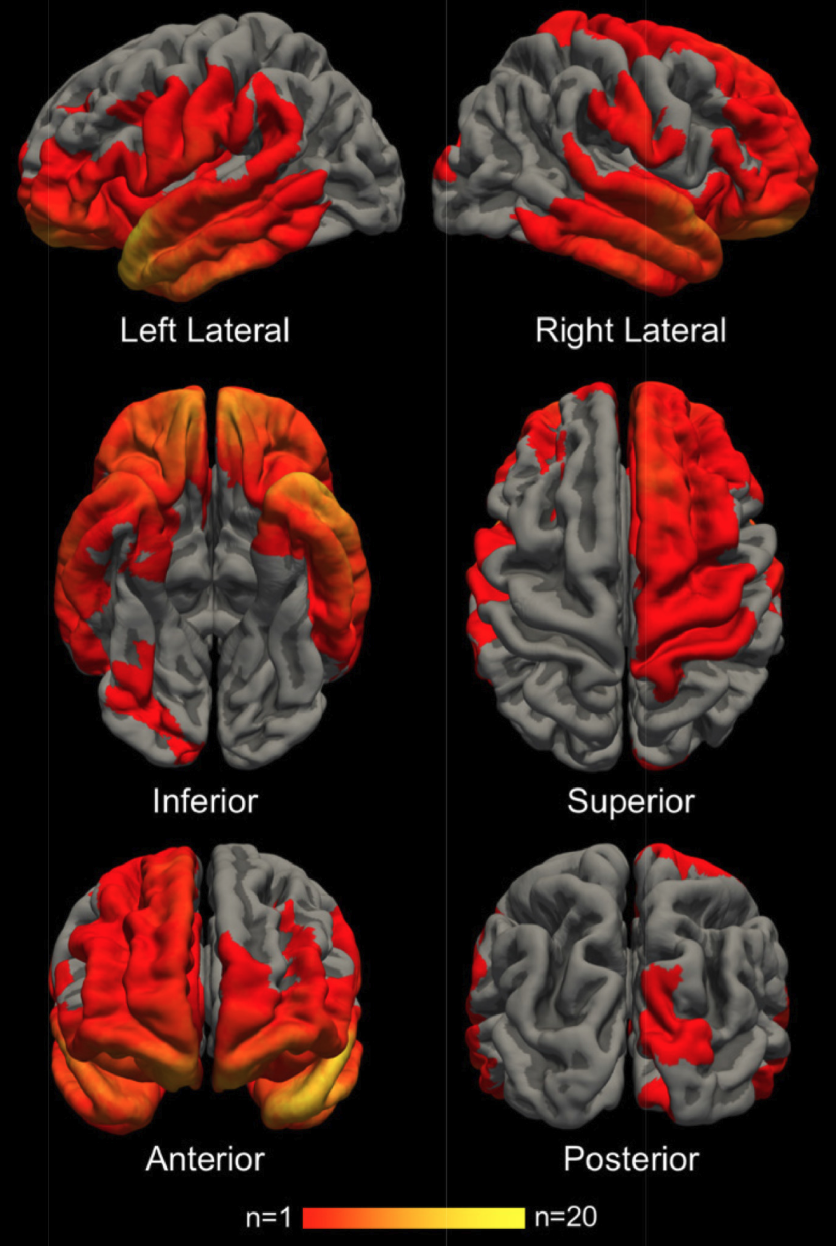
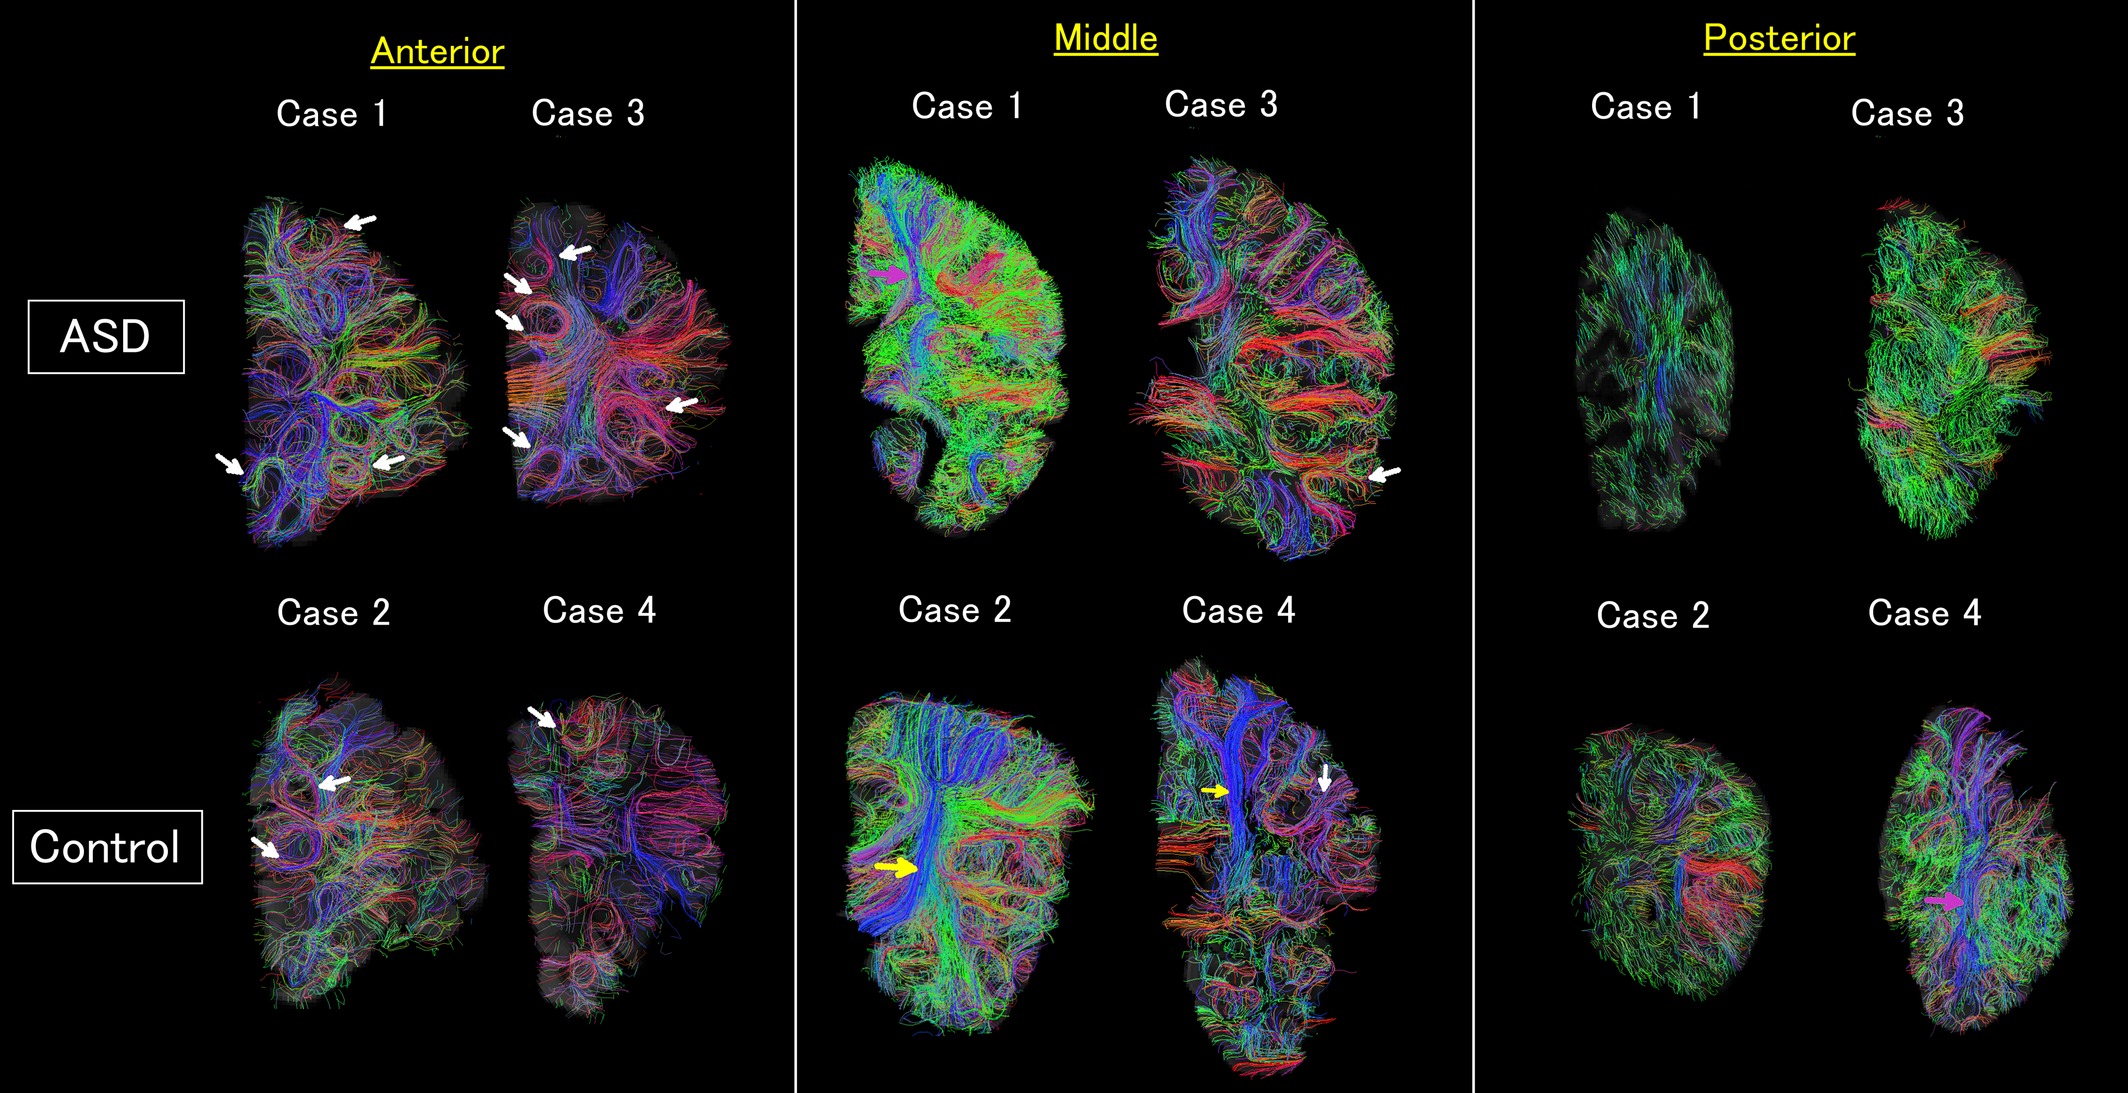
Diffusion imaging
Measures features of water “diffusion” in the brain. Typically, to estimate biological features of the white matter
- Will not focus on this data type in this course
![]()
Diffusion imaging in Autism Wilkinson 2016
Other measures
- Perfusion – Quantitative measure of blood flow
- Spectroscopy
- Many others actively in development
- Many “derivatives” exist and in development
- Derivatives are quantitative values derived from existing modalities