Common mistakes and challenges
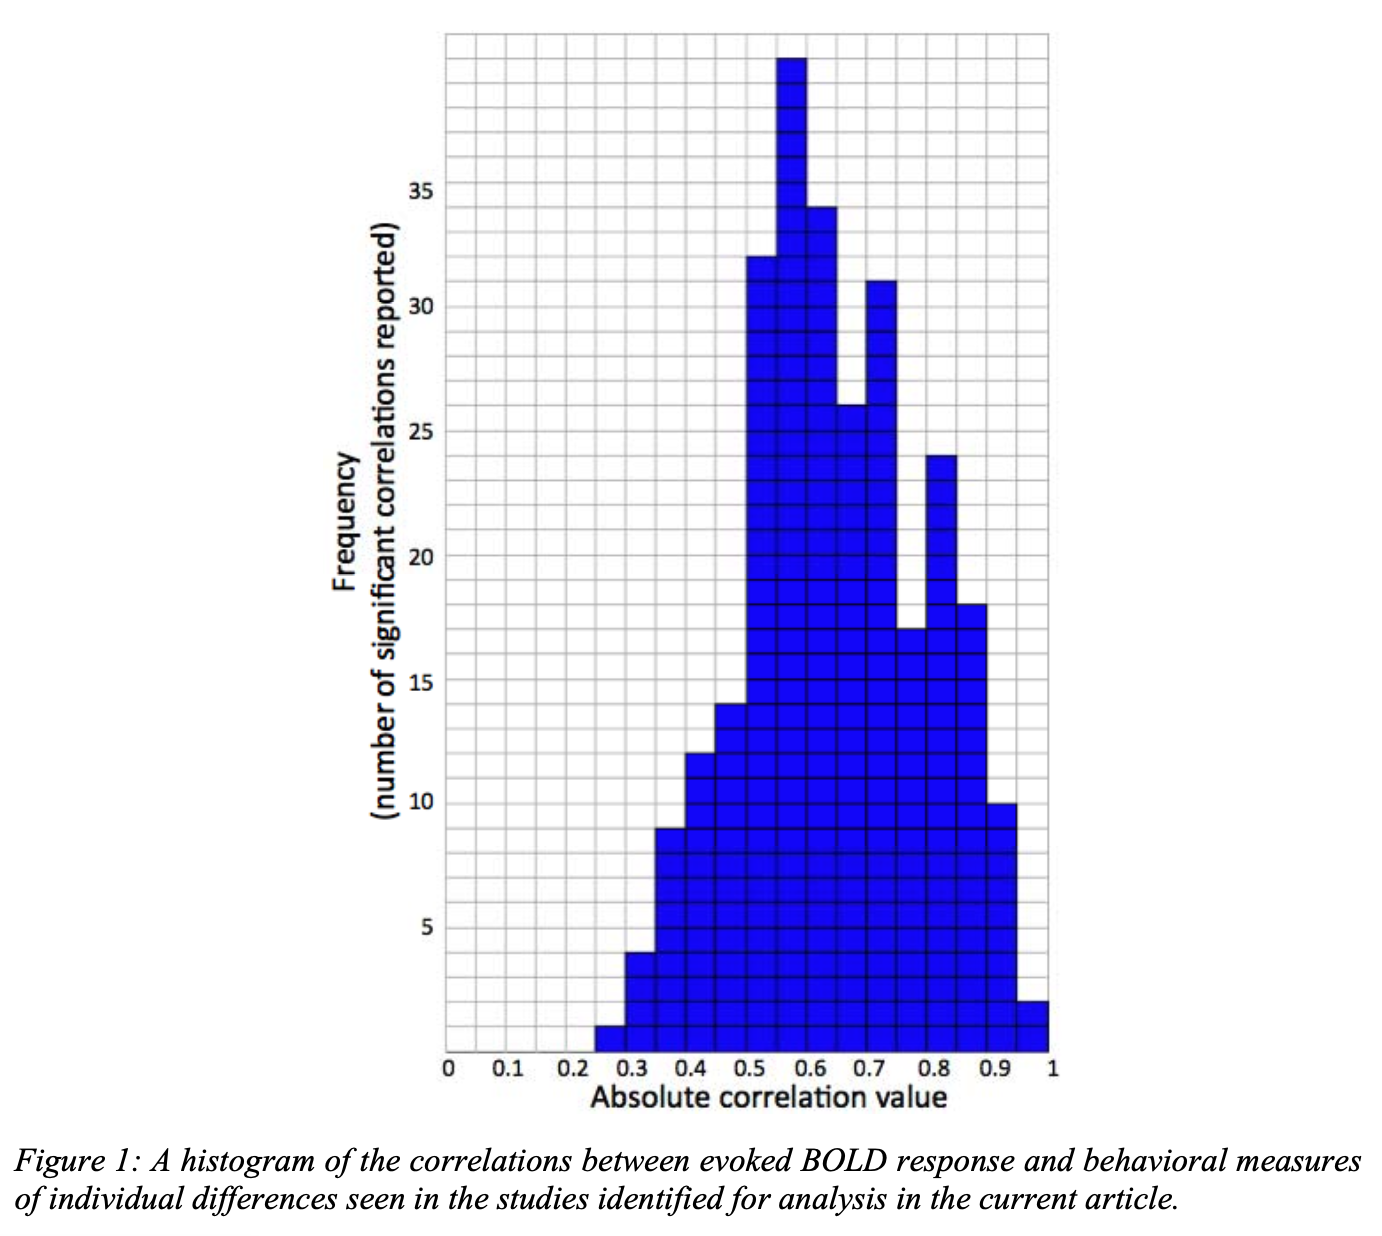
Observed correlations
- They contacted many investigators to collect data across studies.
- Called a meta-analysis
![Correlation Histogram]()
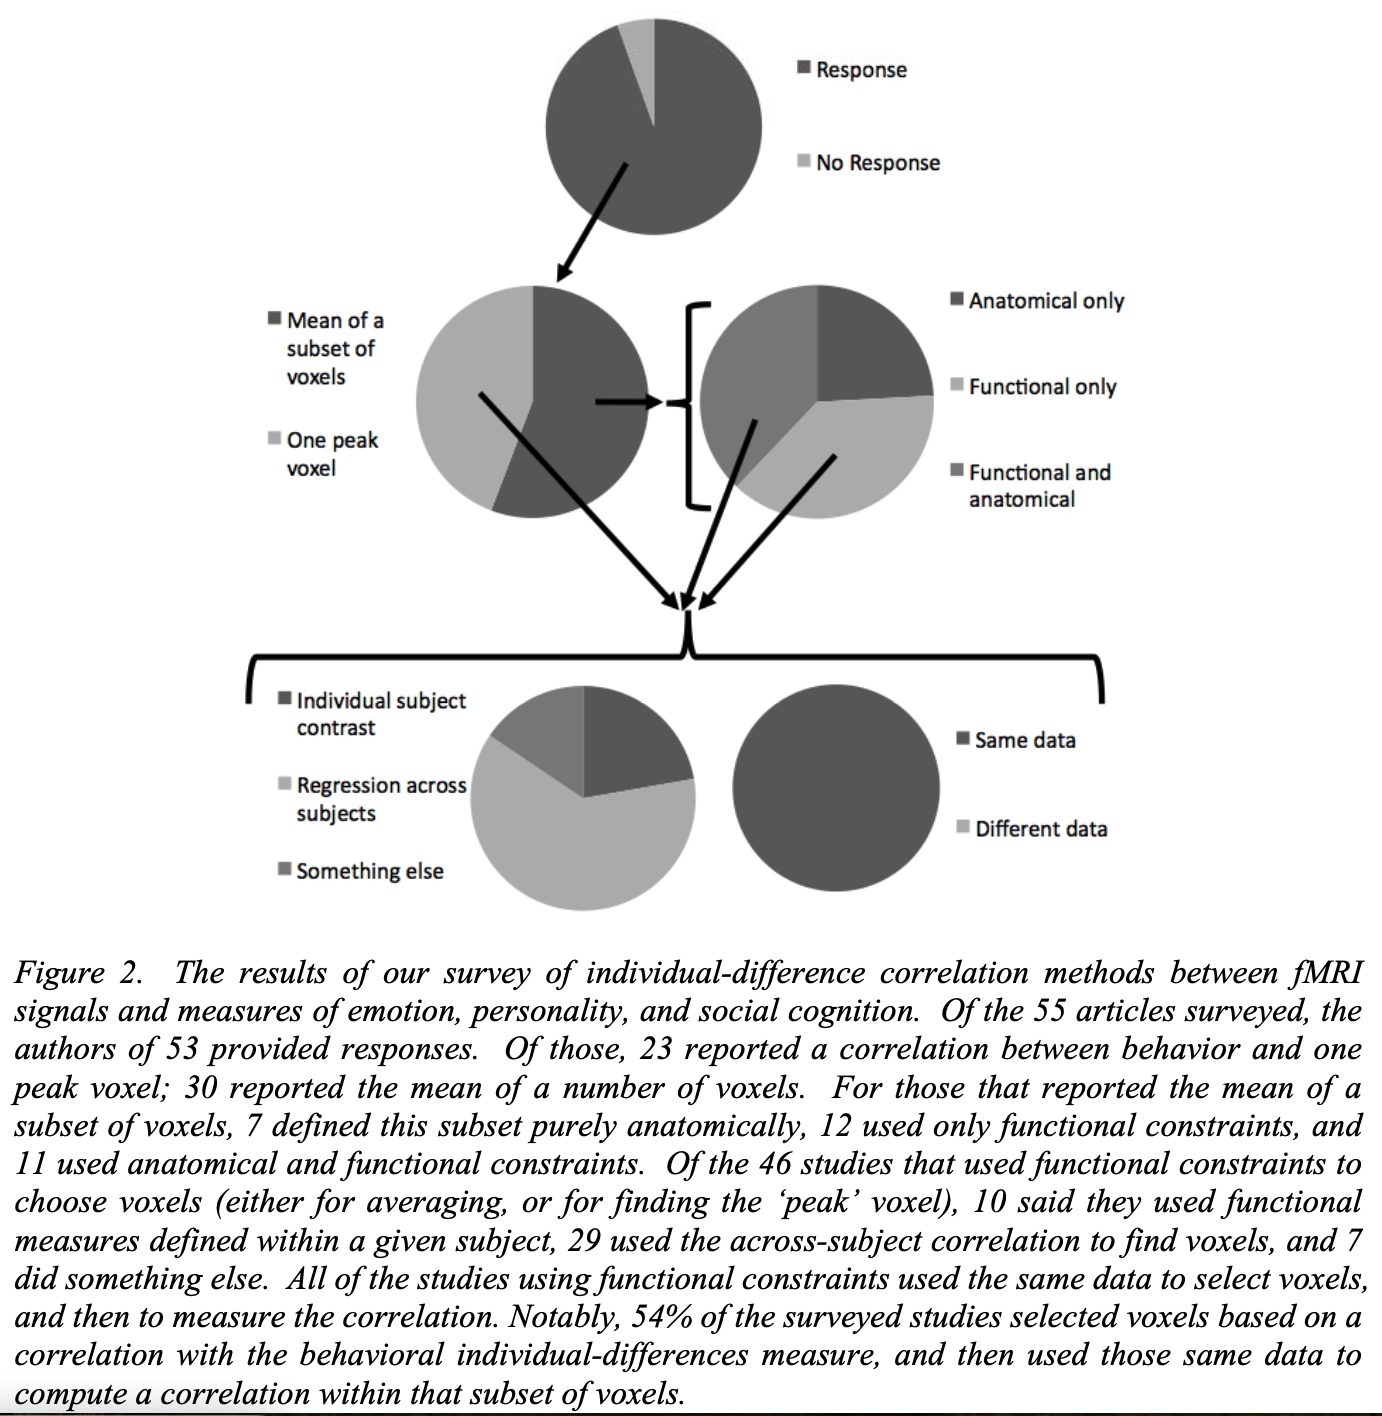
The explanation
- Circularity analysis
Correlation Histogram
Illustration of circularity
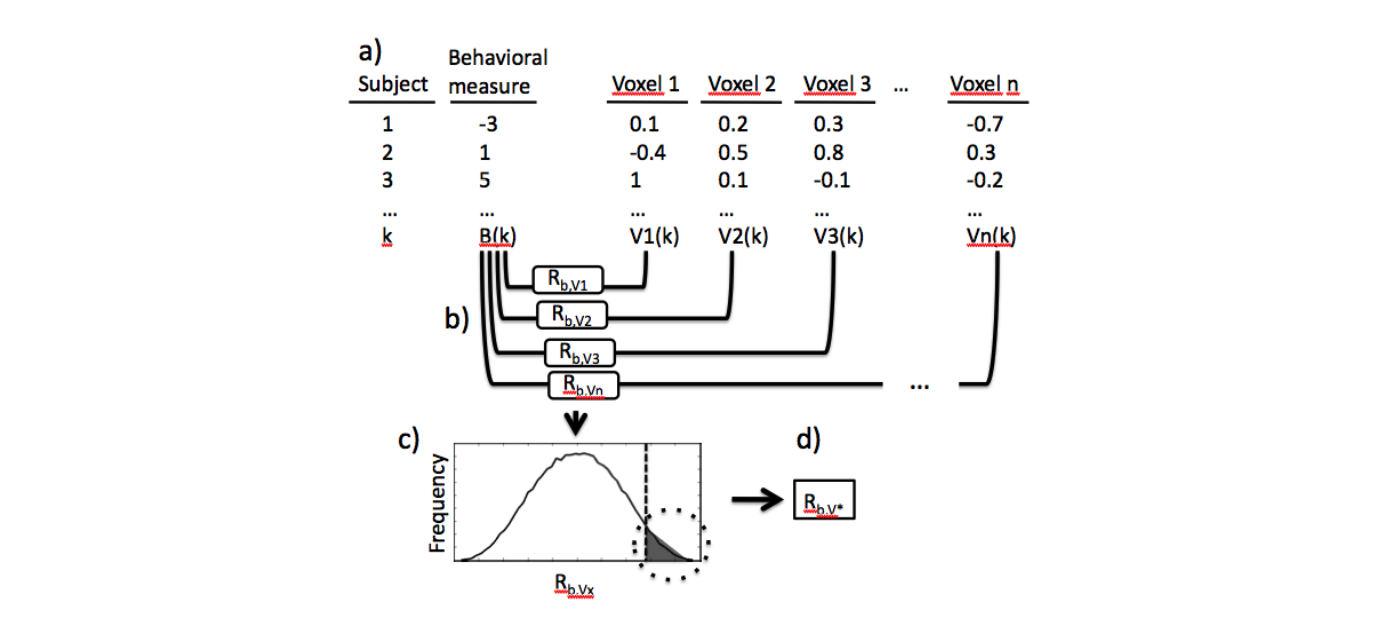
Correlation Histogram
Kriegeskorte Example 1
- Feature selection in ML (“pattern recognition”) models
- What causes the inflated prediction accuracy when using random data?
- How can this be avoided?
- What are alternative feature selection strategies?

ML feature selection
Kriegeskorte Example 2
- This is the same idea as the “Voodoo correlation” discussion above
- Selection via valid inference procedures can lead to biased results in downstream analysis
- It is very common to select regions to analyze based on “task active regions”.
- Depending on how this is defined it could cause bias.
- Would be another interesting project 😉.

Mass-univariate selection bias